Backtested and Broken: How Historical Bitcoin Strategies Collapse in Real Market Conditions
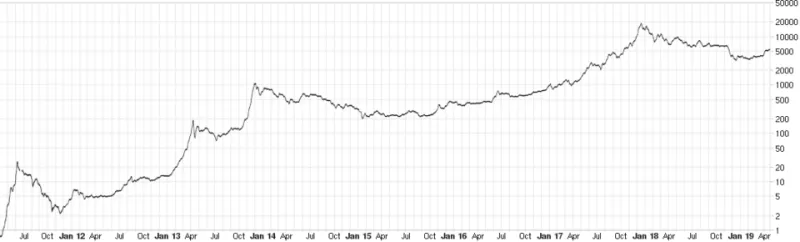
Photo: generated by automated software from public data from trades at BitCoin exchanges Bitstamp and Mt. Gox, Public domain, via Wikimedia Commons
The Illusion of the Perfect Backtest
There is a particular kind of confidence that comes from watching a strategy perform on a chart. The green trades stack up. The drawdowns look manageable. The risk-reward ratio appears clean. For many traders operating in Bitcoin markets, a compelling backtest has become the threshold for conviction — a green light to deploy real capital.
The problem is structural. A backtest does not trade markets. It traces history.
In traditional equity markets, this distinction matters. In Bitcoin, where the market's very architecture has transformed multiple times in a single decade, the distinction is potentially ruinous. Strategies built on 2016 and 2017 price behavior are not just outdated — they are modeling a fundamentally different instrument than the one trading today.
What Changed Between 2017 and 2024
The Bitcoin that retail traders rode to $19,800 in December 2017 operated in a largely unregulated, retail-dominated environment. Futures markets were nascent. Institutional custody solutions barely existed. The CME Bitcoin futures contract had launched only weeks before that peak. Spot ETFs were years away from approval.
Fast-forward to 2024, and the market structure looks almost unrecognizable. Spot Bitcoin ETFs now channel billions of dollars in institutional flows directly into price discovery. Derivatives markets dwarf spot volume on many exchanges. Market makers operate sophisticated delta-neutral strategies that suppress the volatility patterns retail traders once relied upon.
A momentum strategy calibrated on 2016-2017 data might have captured extended parabolic moves with relatively shallow pullbacks. That same strategy, applied to a market where institutional participants actively hedge exposure and arbitrage price inefficiencies across venues, encounters a fundamentally altered environment. The patterns it was designed to exploit have been compressed, front-run, or eliminated entirely.
This is not a theoretical concern. Numerous proprietary trading desks and algorithmic fund managers have documented performance degradation in Bitcoin strategies that remained profitable through 2020 and 2021 but broke down significantly as ETF-driven liquidity reshaped the order book dynamics through 2023 and into 2024.
The Psychological Trap of Curve-Fitting
Beyond the structural argument lies a cognitive one. Human pattern recognition is extraordinarily good at finding signal in noise — and equally good at manufacturing signal where none exists.
When a trader constructs a backtest, they are rarely operating on a blank slate. They have already observed the historical chart. They know where the major highs and lows sit. The strategy parameters they select — the moving average lengths, the RSI thresholds, the volume filters — are unconsciously shaped by the data they are attempting to model. The result is a strategy that fits the past with remarkable precision because it was, in effect, designed around the past.
This phenomenon, known formally as curve-fitting or data-snooping bias, produces strategies that look exceptional in backtests and collapse on first contact with out-of-sample data. In Bitcoin markets, where sample sizes are inherently small — there have been only four major halving cycles — the problem is compounded. A trader optimizing a strategy on two or three cycles is working with insufficient data to distinguish genuine edge from statistical coincidence.
Real Case Study: The Halving Playbook
Consider one of the most widely circulated strategies in Bitcoin retail trading: the halving cycle accumulation model. The logic is intuitive. Bitcoin's supply issuance halves approximately every four years. Historically, the twelve to eighteen months following a halving have produced substantial price appreciation. Buy in the accumulation phase, sell near the cycle peak.
On 2012, 2016, and 2020 data, this framework performed with apparent reliability. Traders who followed a simplified version of this approach during those cycles saw meaningful returns.
Applied to 2024, the model encountered complications. Institutional ETF inflows pulled forward demand that previous cycles had distributed more gradually. Price action during the pre-halving period in early 2024 already reflected significant institutional positioning, compressing the post-halving appreciation window that the historical model had accounted for. Traders who expected a prolonged accumulation phase followed by a clean parabolic advance found themselves either entering too late or misreading the cycle's tempo entirely.
The strategy was not wrong in principle. It was wrong in timing, magnitude, and structural assumption — precisely the variables that backtesting on prior cycles could not have captured.
The Out-of-Sample Problem
Professional quantitative traders in traditional finance apply rigorous out-of-sample testing to evaluate strategy robustness. A strategy is developed on a portion of historical data, then tested on a separate period it was never exposed to during development. Performance degradation between the two periods reveals how much of the in-sample results were genuine edge versus curve-fitting.
Most retail Bitcoin traders skip this step entirely. The backtest covers all available history, the results look favorable, and the strategy goes live. There is no holdout period, no walk-forward analysis, no stress testing against different market regimes.
For strategies with fewer than one hundred trade samples across multiple market cycles — which describes the vast majority of Bitcoin backtests given the asset's age — the statistical significance of even strong backtest results is limited. A strategy that shows a 68% win rate across forty trades is not meaningfully distinguishable from random chance at conventional confidence intervals.
Building Strategies That Acknowledge Their Own Limitations
None of this argues against the use of historical analysis. On-chain data, price structure, and cycle behavior all carry genuine informational value. The error lies in treating a backtest as a predictive instrument rather than a descriptive one.
More durable approaches treat historical patterns as context rather than rules. They incorporate regime detection — acknowledging that a trend-following strategy may perform well in low-liquidity bull markets and catastrophically in ETF-dominated conditions. They apply position sizing that reflects uncertainty rather than the false precision of a backtest's Sharpe ratio. And they build in explicit mechanisms for recognizing when current market behavior has diverged from the historical template the strategy was built on.
For American traders operating in an increasingly institutionalized Bitcoin market, the most important analytical skill may not be finding patterns that worked in the past. It may be developing the discipline to recognize when those patterns no longer apply — before the capital account reflects the lesson.