Stillwater Markets: How Bitcoin's Sideways Phases Quietly Redistribute Wealth Before the Next Move
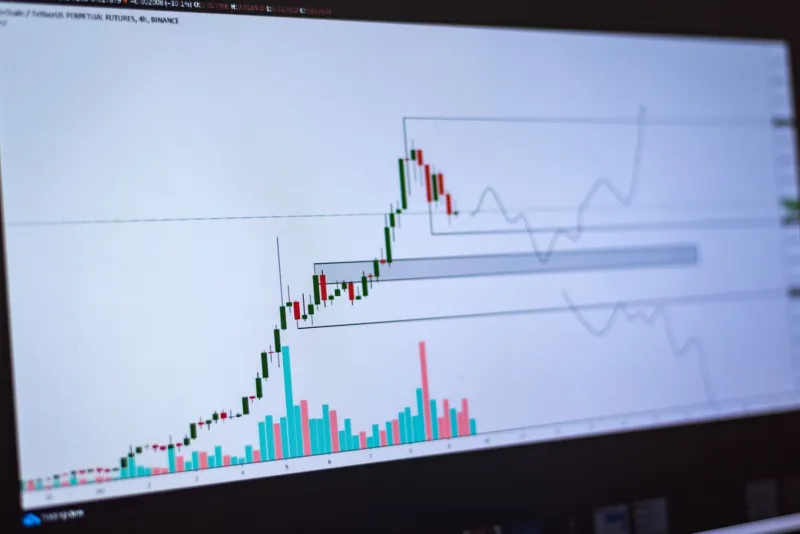
There is a particular frustration that grips retail Bitcoin traders during prolonged consolidation. The price sits stubbornly within a narrow band for weeks, sometimes months. Charts produce no clean signals. Social media quiets. The temptation to reallocate capital — or simply walk away — grows with every flat daily candle. That frustration, it turns out, is not incidental. It is, in many respects, the point.
Bitcoin's consolidation phases are among the most misread environments in all of crypto markets. They appear to be neutral. They are rarely neutral. What looks like a market catching its breath is frequently a structured redistribution event — one that ends with retail traders either better positioned than they realize, or quietly depleted of the coins they will soon wish they had kept.
Why Sideways Movement Feels Like a Signal — and Usually Isn't
Human pattern recognition is poorly suited to range-bound markets. Traders who study technical analysis are trained to look for direction: higher highs, lower lows, trend continuations, reversals. When price oscillates between two relatively fixed levels, the brain imposes structure where little exists. A bounce off support reads as bullish confirmation. A rejection at resistance reads as a warning to exit. Both interpretations may be correct in the short term and catastrophically wrong over the medium term.
This dynamic produces what analysts sometimes call the consolidation trap. A trader enters a long position when Bitcoin bounces convincingly off a support level. Price drifts back toward resistance, stalls, and begins to retrace. The trader, reading this as a failed breakout, exits at a small loss or reduced gain. That sequence — enter, hold through noise, exit on doubt — repeats enough times that the trader has effectively sold a position that was about to deliver significant returns.
The trap is not primarily technical. It is psychological. Consolidation exhausts conviction before it exhausts price.
What On-Chain Data Reveals That Charts Cannot
The distinction between a consolidation phase that precedes a genuine breakout and one that simply continues indefinitely is rarely visible in price action alone. It is, however, frequently legible in on-chain metrics — provided you know where to look.
Exchange Net Position Change is among the most reliable early signals. When Bitcoin is flowing off exchanges at an accelerating pace during a sideways market, it suggests that entities with long time horizons — often institutional buyers or high-conviction retail holders — are moving coins into cold storage. They are not trading. They are removing supply from the market entirely. When that trend persists through multiple weeks of flat price action, the available float of Bitcoin on exchanges shrinks even as price remains range-bound. The eventual imbalance between tightening supply and any incremental demand increase is what produces explosive moves.
Realized Price by Cohort adds another layer. On-chain analytics platforms can segment Bitcoin holders by when their coins last moved, creating a picture of whether short-term holders are accumulating or distributing. During genuine pre-breakout consolidations, short-term holder realized price tends to cluster near the lower boundary of the range — meaning recent buyers are sitting just above support, not chasing price into resistance. This is a structurally stable accumulation pattern. When short-term holder realized price clusters near the top of the range, it suggests that late entrants are holding overextended positions, and the risk of a downside flush increases substantially.
Coin Days Destroyed (CDD) is a third metric worth monitoring. CDD measures the movement of older coins — specifically, how many days of accumulated holding time are being "spent" in a given period. Low CDD during consolidation indicates that long-term holders are not distributing. They are waiting. Historically, extended periods of low CDD followed by price compression have preceded some of Bitcoin's most significant directional moves.
Distinguishing Genuine Accumulation from Trapped Liquidity
Not every consolidation phase is a coiled spring. Some are simply periods of genuine indecision in which no dominant force — buyer or seller — has sufficient conviction to move price meaningfully. Distinguishing between these scenarios requires combining on-chain data with structural price analysis.
A consolidation phase that reflects genuine accumulation typically exhibits the following characteristics: declining exchange reserves over the duration of the range; a gradual upward drift in the lower boundary of the range (higher lows forming quietly within the broader sideways structure); and muted funding rates in perpetual futures markets, indicating that leveraged traders are not building aggressive positions in either direction.
A consolidation phase that reflects trapped liquidity — the less favorable scenario — tends to show the opposite. Exchange reserves remain flat or increase slightly. The range boundaries hold rigidly, with neither side gaining structural advantage. Funding rates oscillate with each small directional move, suggesting that short-term speculators are churning positions without directional conviction. In these environments, the eventual resolution is often a sharp, painful flush in one direction designed to clear out the accumulated stop orders on both sides before any sustained trend develops.
A Practical Framework for American Retail Traders
For US-based traders managing Bitcoin positions through consolidation, the following approach offers a more disciplined alternative to pattern-chasing on price charts.
First, establish a baseline. At the outset of any consolidation phase, record the exchange net position data and short-term holder realized price. These are your reference points. Check them weekly, not daily — daily noise will mislead you.
Second, define your invalidation conditions before you need them. If exchange reserves begin rising meaningfully, or if CDD spikes without a corresponding price move, those are signals that large holders may be distributing into the range. Adjust your position sizing accordingly.
Third, resist the impulse to trade the range actively unless you have a systematic, backtested approach for doing so. Range-trading Bitcoin during consolidation can be profitable, but it requires precise execution and carries the constant risk of being caught offside when the breakout occurs. For most retail participants, the cost of being out of position at the moment of a genuine breakout exceeds the incremental gains from successful range trades.
Finally, treat the emotional discomfort of consolidation as information. The urge to exit a position simply because price is going nowhere is a sentiment signal in itself. Historically, the moments when Bitcoin feels most boring — when the conversation has moved elsewhere and the daily candles offer nothing — have often been the moments closest to significant price discovery.
The Opportunity Hiding in Plain Sight
Bitcoin's consolidation phases do not reward the most active traders. They reward the most attentive ones. The real opportunity during sideways markets is not found in scalping the range or timing a breakout with precision. It is found in correctly identifying whether the underlying structure of the market is accumulative or distributive — and positioning accordingly before price confirms what the chain already knows.
The traders who miss that opportunity are not the ones who lacked access to sophisticated tools. They are the ones who let the stillness of the price chart convince them that nothing was happening.
On-chain, something is almost always happening.

